CO2 performance ladder
The study was conducted by Stapper according to the CO2 performance ladder (methodology of the independent Foundation for Climate-Friendly Procurement and Business) across the entire Concrete Valley organisation, which includes Waco, Microbeton, mbX, Timber Structures, Concrete Valley Projects Ltd. To determine CO2 emissions, the organisation is divided into office/workshop and mobility sections, both of which are in turn divided into subcategories such as natural gas consumption, electricity consumption, vehicle fleet and air travel. The inventory was first conducted in 2017, which is used as the base year.
Direct and indirect emissions
In determining total CO2 emissions, five more greenhouse gases are included, namely: CH4, N2O, HFCs, PFCs and SF6. To add up the impact of different greenhouse gases, emission figures are converted into CO2 equivalents. The conversion is based on the ‘Global Warming Potential’ (GWP), the extent to which a gas contributes to the greenhouse effect.
In accordance with the protocol, a distinction is made within CO2 emissions in scope 1, scope 2 and scope 3.Scope 1 includes only direct greenhouse gas emissions we emit ourselves caused by burning fossil fuels. Scope 2 is indirect emissions. This includes electricity, which is the emissions released when electricity is produced. Finally, our organisation releases indirect CO2 emissions over which we have no control, for example, waste processing by an external party.
Conclusion
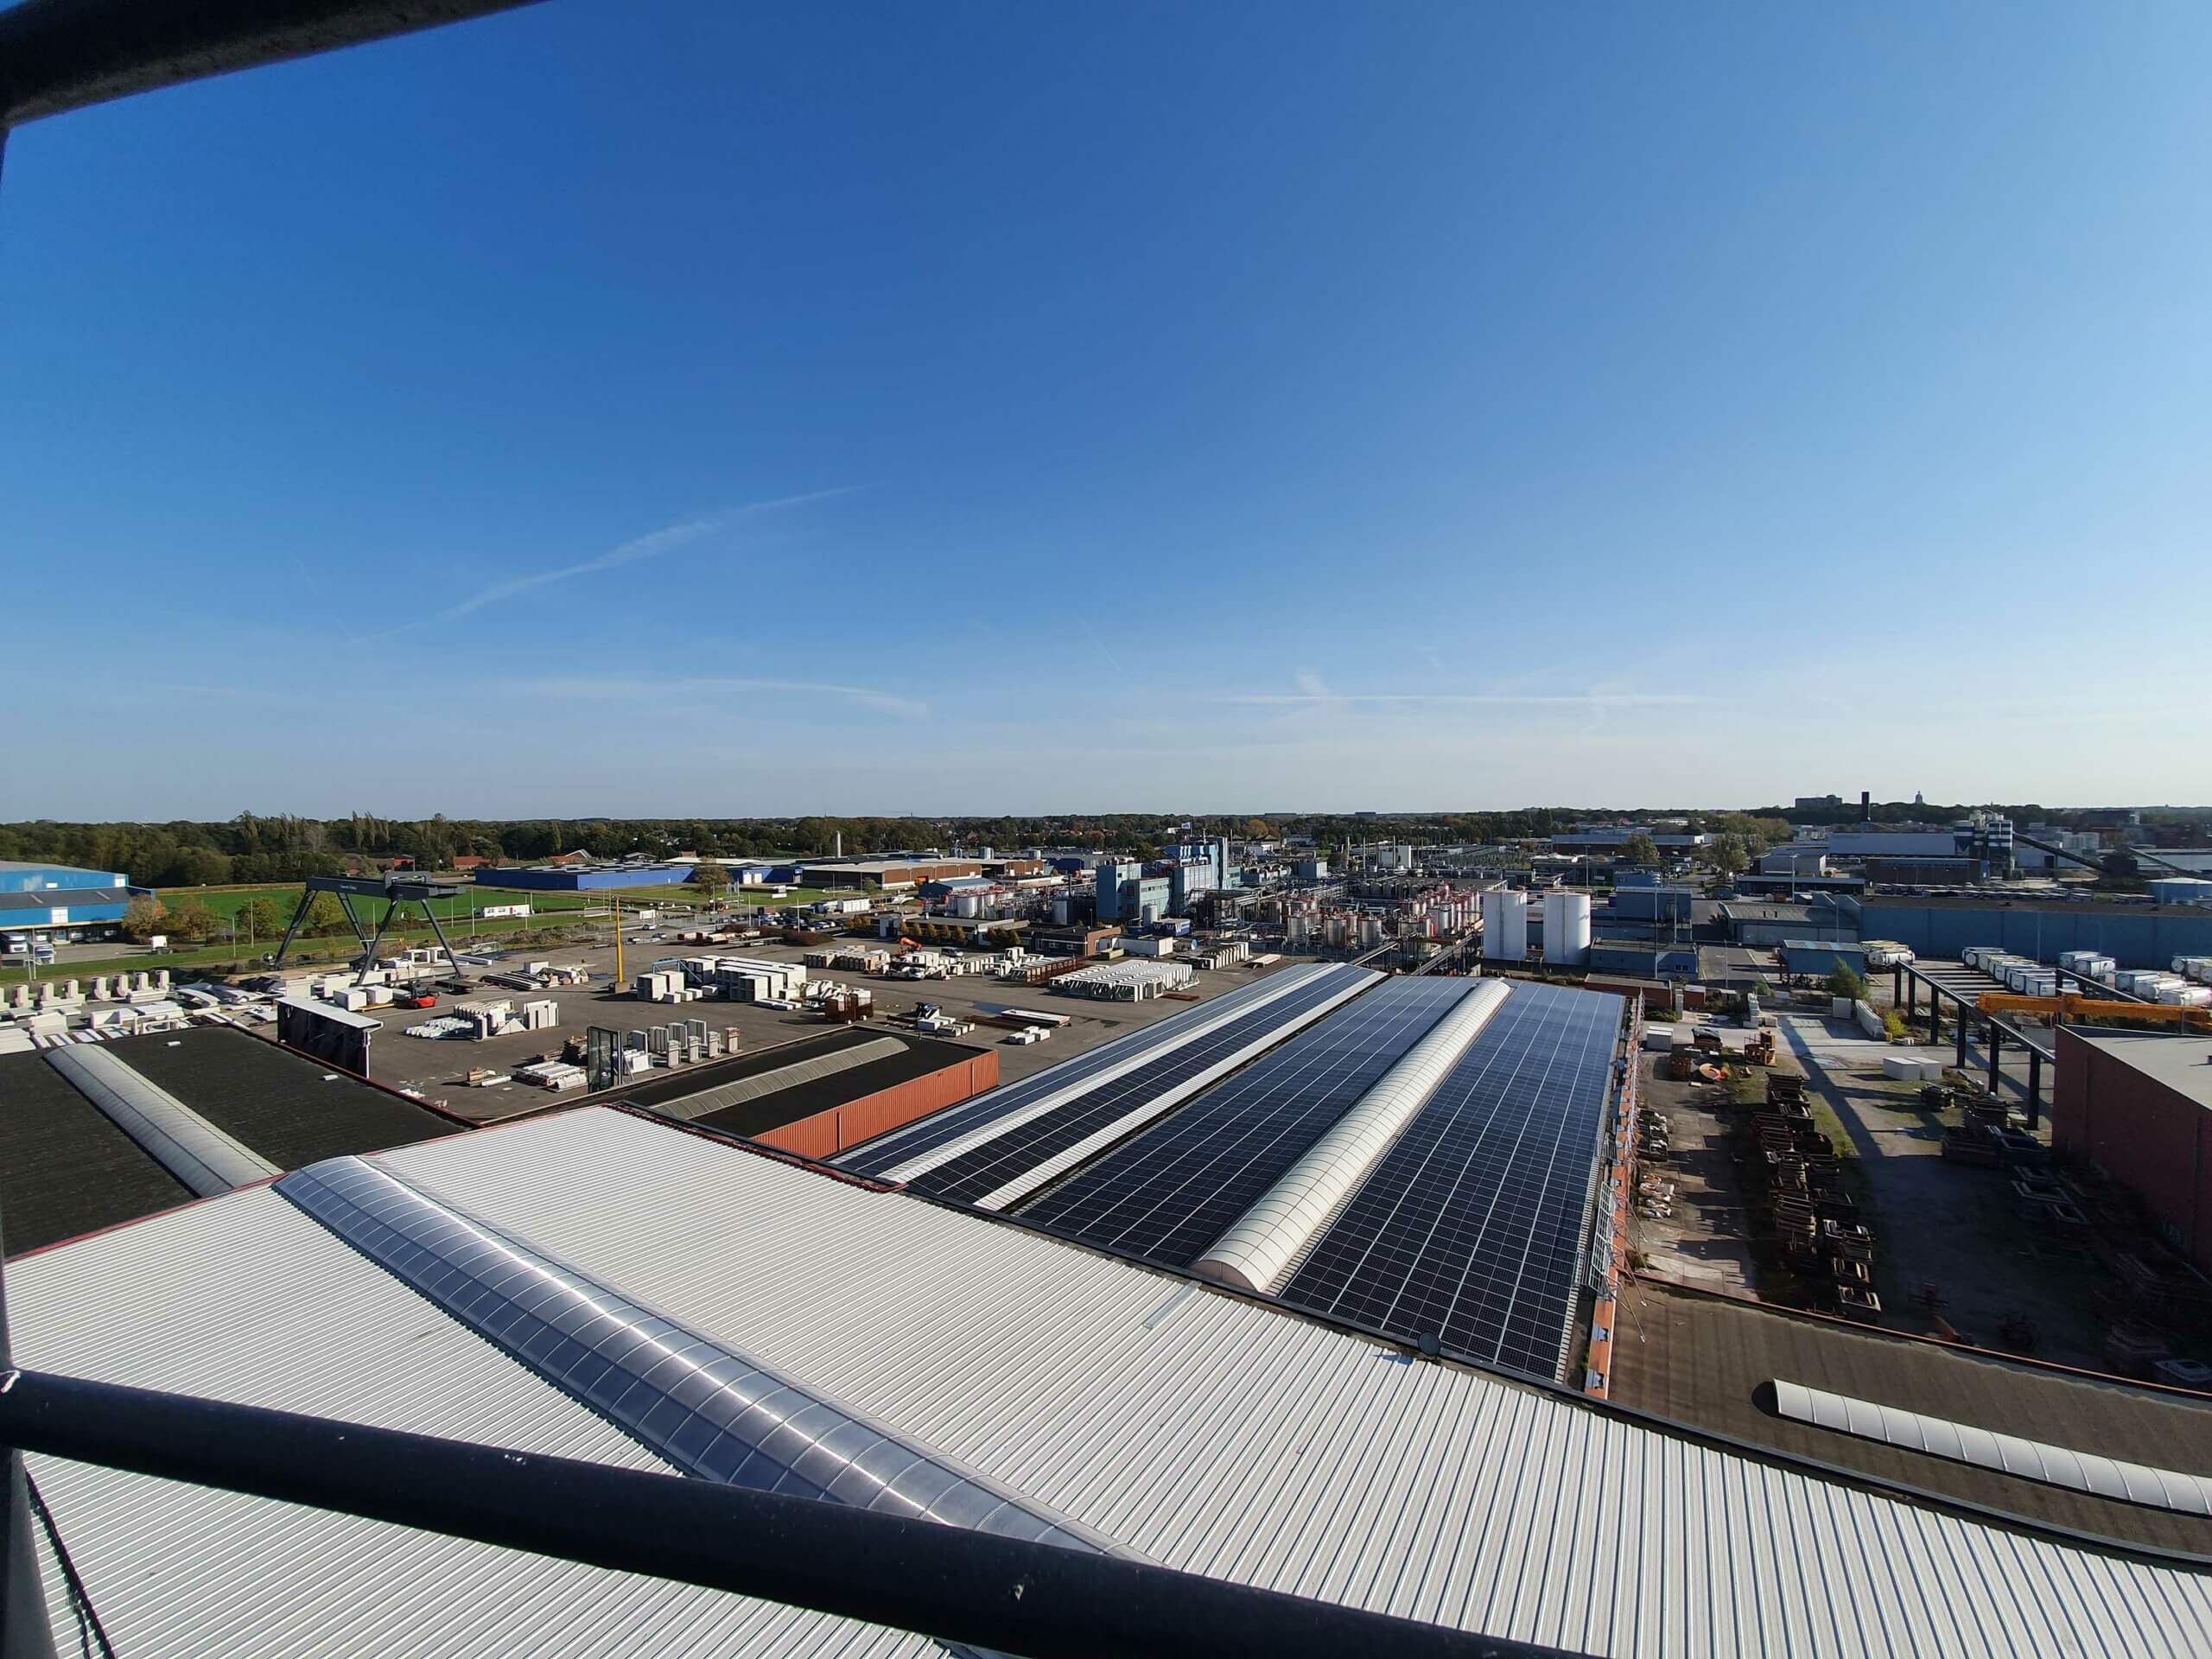
In recent years, Concrete Valley has focused heavily on making the organisation more sustainable. This produced a good result. Concrete Valley’s total scope 1 and 2 CO2 emissions were 290.99 tonnes in 2022 compared to 380.61 tonnes in 2017, 360.50 tonnes in 2020 and 337.19 tonnes in 2021. CO2 emissions per FTE have fallen again. In 2020, average emissions were still 6.32 tonnes CO2/FTE; in 2021, they were 5.44 tonnes CO2/FTE; in 2022, they dropped again to 4.28 tonnes CO2/FTE. In 2023, this CO2 emission reduction will earn us a gold CSC certification.


